The best Seeking Alpha alternatives in 2026 are Morningstar Investor for analyst-led stock and fund research, Koyfin for charts, data and dashboards, and Stock Analysis for free or $79-a-year fundamentals. None of the eight tools we ranked replaces Seeking Alpha’s whole bundle on its own, so choose based on the Seeking Alpha features you actually use.
Seeking Alpha Premium lists at $299 a year, billed annually (Seeking Alpha, November 2026). Subscribers on r/SeekingAlpha complain about price increases and large jumps between tiers (r/SeekingAlpha, November 2024–October 2026). G2 reviewers say the daily volume of contributor articles can be overwhelming (G2, November 2026).
Weigh Apps has no affiliate relationships with any company listed, and rankings are determined entirely by research data and objective evaluation criteria.
One r/SeekingAlpha user summed up the trade-off: Premium is “pretty cheap, but you’ll have to filter through a lot of noise.” (r/SeekingAlpha, November 2024–October 2026)
Takeaway: The price of Seeking Alpha Premium is rarely the only complaint. The time spent filtering through contributor articles is part of the cost.
Why Do Investors Look for a Seeking Alpha Alternative?
Investors usually leave Seeking Alpha, or add a second tool, because they can buy the parts they actually use more cheaply or in more depth elsewhere. Tier pricing and the volume of contributor articles are the two most common complaints. Most switchers replace only part of the Seeking Alpha bundle, not all of it.
Seeking Alpha holds a 4.1/5 rating on G2 from 31 reviews, and 83.9% of those reviews give 4 or 5 stars (G2, November 2026).
G2’s review summary says reviewers like Seeking Alpha’s insights, its ease of use and its range of contributor views. Some reviewers find the daily volume of entries overwhelming (G2, November 2026). G2 shows no counted pros or cons for Seeking Alpha.
Seeking Alpha users on Reddit raise three recurring complaints (r/SeekingAlpha, November 2024–October 2026):
- One r/SeekingAlpha user called the price jump between Premium, Alpha Picks and Pro “huge.”
- Another r/SeekingAlpha user dropped a tier “due to the last price increase.”
- Seeking Alpha subscribers on Reddit disagree about whether Alpha Picks or the Premium quant data is the part worth paying for. Weigh Apps treats these claims as sentiment, not as evidence of performance.
What Does Seeking Alpha Actually Include?
Seeking Alpha bundles contributor articles, quant ratings, stock screening, news, portfolio tracking and stock picks across four tiers: Basic, Premium, Alpha Picks and Pro. Seeking Alpha Premium is the usual comparison point. It lists at $299/year, billed annually only, with a 7-day trial (Seeking Alpha, November 2026).
Seeking Alpha’s pricing looks different depending on the source:
- Seeking Alpha’s own subscription page lists Premium at $299/year, billed annually, with a 7-day trial (Seeking Alpha, November 2026).
- Seeking Alpha’s first-year promotions changed during November 2026. We observed $239 early in the month, and a third-party comparison reported $215 late in the month (StockResearchHub, November 2026). Both are introductory prices, not renewal prices.
- G2 lists “Basic: $29.99 Flat Rate Per Month” (G2, November 2026). That conflicts with Seeking Alpha’s own page, which shows Basic as free, and G2 list prices can change.
Seeking Alpha is the baseline for this article and is not ranked. Every price below is compared with Seeking Alpha Premium’s $299/year list price. Check each tier’s current inclusions on Seeking Alpha’s site before you subscribe.
What Are the 4 Categories of Seeking Alpha Alternative Tools?
Seeking Alpha alternatives fall into four categories, and each one replaces a different part of Seeking Alpha’s bundle. Analyst research platforms replace contributor articles. Data terminals supply raw financials. Screeners filter and track holdings. Ratings services turn analyst opinion or estimate revisions into buy and sell signals.
- Analyst Research Platform: An analyst research platform, such as Morningstar Investor, publishes its own analyst valuations and ratings instead of crowdsourced contributor articles.
- Data & Charting Terminal: A data and charting terminal, such as Koyfin, Stock Analysis or TIKR, provides financials, estimates, charts and dashboards so investors can form their own view.
- Screener & Portfolio Analyzer: A screener and portfolio analyzer, such as Stock Rover or Finviz, filters stocks by fundamentals or technicals and tracks or analyzes holdings.
- Ratings Signal Service: A ratings signal service, such as TipRanks or Zacks, turns analyst ratings or earnings-estimate revisions into a ranked buy/sell signal.
How a rating is built affects how much you should trust it. The list below describes how each method works. It does not claim that any method performs better.
- Morningstar Investor ties its star ratings to analyst fair-value estimates and uncertainty ratings (Morningstar help center, November 2026).
- TipRanks aggregates Wall Street analyst ratings and tracks each analyst’s past performance (TipRanks, November 2026).
- Zacks Rank rates stocks from #1 (Strong Buy) to #5 (Strong Sell) using four earnings-estimate-revision factors: Agreement, Magnitude, Upside and Surprise (Investopedia, November 2026).
- Seeking Alpha’s Quant Ratings compare more than 100 metrics against sector peers. Seeking Alpha combines five factor grades (Valuation, Growth, Profitability, Momentum and EPS Revisions) into one rating (Seeking Alpha help center, November 2026).
These systems can disagree on the same stock. Say analysts raise next-year EPS estimates on a stock that trades above fair value. Zacks Rank may improve while Morningstar’s star rating stays low. Both systems are working as designed, because they measure different things.
How Do the Top Seeking Alpha Alternatives Compare at a Glance?
Morningstar Investor, Koyfin and Stock Analysis lead the ranking within 0.1 points of each other. The top five scores fall within 0.2 points, so the “best for” labels matter more than the order. Stock Rover and TIKR lead on data depth. TipRanks, Finviz and Zacks each do one job well and work best as a second tool.
| Rank | Company | Category | Best For | One-Line Summary | Key Capabilities | Primary Strength | Key Limitation |
|---|---|---|---|---|---|---|---|
| 1 | Morningstar Investor | Analyst Research Platform | Long-term stock and fund/ETF investors | Morningstar Investor is the closest Seeking Alpha alternative for analyst-led valuation research at a lower annual list price. | Fair-value estimates, uncertainty ratings, moat analysis, fund/ETF research | Published rating methodology | One house view; no free tier |
| 2 | Koyfin | Data & Charting Terminal | Data-first investors | Koyfin is the highest-ranked data-first Seeking Alpha alternative in our scoring, with a usable free plan. | 10 years of financials and estimates, screens, transcripts, dashboards | Data depth plus free plan | No articles or proprietary ratings |
| 3 | Stock Analysis | Data & Charting Terminal | Cost-cutters | Stock Analysis is the lowest-cost Seeking Alpha alternative, with free data and a $79/year Pro plan. | Free statements, ratios, screener; aggregated analyst ratings | Lowest verified paid price | No original analysis |
| 4 | Stock Rover | Screener & Portfolio Analyzer | Screeners and portfolio analysts | Stock Rover is the Seeking Alpha alternative for deep fundamental screening and portfolio analysis. | Up to 800+ metrics and 20 years on top tiers, portfolio tools, free plan | Deepest documented history | Premium costs more than Seeking Alpha Premium |
| 5 | TIKR | Data & Charting Terminal | Global fundamental investors | TIKR is the Seeking Alpha alternative for global financials, estimates and transcripts. | Global coverage, estimates, transcript history | International data depth | Free plan is U.S.-only |
| 6 | TipRanks | Ratings Signal Service | Ratings-focused investors | TipRanks is the Seeking Alpha alternative that shows analyst ratings next to each analyst’s tracked record. | Aggregated analyst ratings, analyst track records, Smart Portfolio | Track-record trust model | Premium costs $360/year |
| 7 | Finviz | Screener & Portfolio Analyzer | Active traders | Finviz is the Seeking Alpha alternative for fast screening, real-time quotes and alerts. | Screener, charts, alerts, exports | Free screener plus speed | Renewal price erases most savings |
| 8 | Zacks | Ratings Signal Service | Estimate-revision followers | Zacks is the Seeking Alpha alternative for a quant ranking built on earnings-estimate revisions. | Zacks Rank #1–#5, four revision factors | Defined, explainable signal | Coverage and price least documented |
Quick Decision Framework
| Your #1 Priority | Recommended Tool | Why | Acceptable Alternative |
|---|---|---|---|
| Analyst-written valuation research | Morningstar Investor | Published fair-value and moat framework at $249/year | TIKR (for reading transcripts yourself) |
| Fund and ETF research | Morningstar Investor | Covers funds and ETFs alongside stocks | Koyfin (ETF holdings data) |
| Data, charts and dashboards | Koyfin | 10 years of financials and estimates on Plus; usable free plan | TIKR |
| Lowest possible cost | Stock Analysis | Free tier; Pro at $79/year | Finviz free screener |
| International stocks | TIKR | Global coverage on paid tiers; Plus at $215.40/year billed annually | Koyfin |
| Deep fundamental screening and portfolio analysis | Stock Rover | Up to 800+ metrics and 20 years of history on top tiers | Koyfin |
| Active trading scans and alerts | Finviz | Real-time quotes, charts and alerts on Elite | Koyfin |
| Ratings you can check against a track record | TipRanks | Tracks each analyst’s past performance | Zacks |
| A second quant signal | Zacks | Four-factor estimate-revision ranking | TipRanks |
| Budget of $0 | Free stack (Stock Analysis, Finviz, Koyfin free plans) | Covers financials, screening and dashboards at no cost | TIKR free plan (U.S. stocks) |
| Budget under $100/year | Stock Analysis Pro | $79/year, about $220 below Seeking Alpha Premium | Stock Analysis free |
| Budget under $250/year | Morningstar Investor (analysis) | $249/year billed annually | TIKR Plus at $215.40/year (data) |
| Budget above $299/year | Koyfin Plus | Deepest dashboards and data for data-first investors | Stock Rover Premium or TipRanks Premium |
Which Seeking Alpha Jobs Does Each Alternative Cover, and at What Annual Cost?
Each alternative covers two to four of the jobs Seeking Alpha bundles together, and none covers all of them. The table below maps each tool to those jobs and converts every price to a normalized annual figure. “Not confirmed” means our November 2026 research could not verify the feature. It does not mean the feature is missing.
| Tool | Written Analysis | Ratings | Screening | Charting | Portfolio Tracking | ETF/Fund Coverage | Normalized Annual List Price | Monthly Option | Free Tier | Source & Date |
|---|---|---|---|---|---|---|---|---|---|---|
| Seeking Alpha Premium (Baseline, not ranked) | Yes (contributors) | Yes (quant: 5 factor grades, 100+ metrics) | Yes | Not confirmed | Yes | Not confirmed | $299 ($239 and $215 first-year promos observed) | No (annual only) | Basic (vendor) | Vendor page, Nov 2026 |
| Morningstar Investor | Yes (house analysts) | Yes (fair-value stars) | Not confirmed | Not confirmed | Not confirmed | Yes | $249 annual; ~$419 at $34.95/mo | Yes ($34.95) | No (7-day trial) | Vendor pricing, Nov 2026 |
| Koyfin (Plus) | No | No | Yes | Yes | Not confirmed | Yes | $468 at monthly rate; ~$328 annual (up to 30% off) | Yes ($39) | Yes | Vendor page, Nov 2026 |
| Stock Analysis (Pro) | No | Aggregated | Yes | Not confirmed | Not confirmed | Not confirmed | $79 annual; ~$120 at $9.99/mo | Yes ($9.99) | Yes | Vendor page, Nov 2026 |
| Stock Rover (Premium) | No | Not confirmed | Yes (stocks/ETFs) | Not confirmed | Yes | Yes | $348 annual; $34/mo option | Yes ($34) | Yes (plus 14-day trial) | stockrover.com, Nov 2026 |
| TIKR (Plus) | No | No | Not confirmed | Not confirmed | Not confirmed | Not confirmed | $215.40 annual; $299.40 monthly | Yes ($24.95) | Yes (U.S. only) | app.tikr.com/pricing, Nov 2026 |
| TipRanks (Premium) | No | Yes (analyst aggregation) | Not confirmed | Not confirmed | Yes (Smart Portfolio) | Not confirmed | $360 | Not confirmed | Yes (Basic) | tipranks.com/plans, Nov 2026 |
| Finviz (Elite) | No | No | Yes | Yes | Not confirmed | Not confirmed | $299.50 renewal ($149 first year); $39.50/mo | Yes ($39.50) | Yes (delayed data) | finviz.com/elite, Nov 2026 |
| Zacks (Premium) | Not confirmed | Yes (Zacks Rank) | Not confirmed | Not confirmed | Not confirmed | Not confirmed | $249 (third-party; confirm) | Not confirmed | Not confirmed; 30-day trial reported | Third-party summaries, Nov 2026 |
1. Morningstar Investor: Best Overall for Analyst-Led Stock and Fund Research
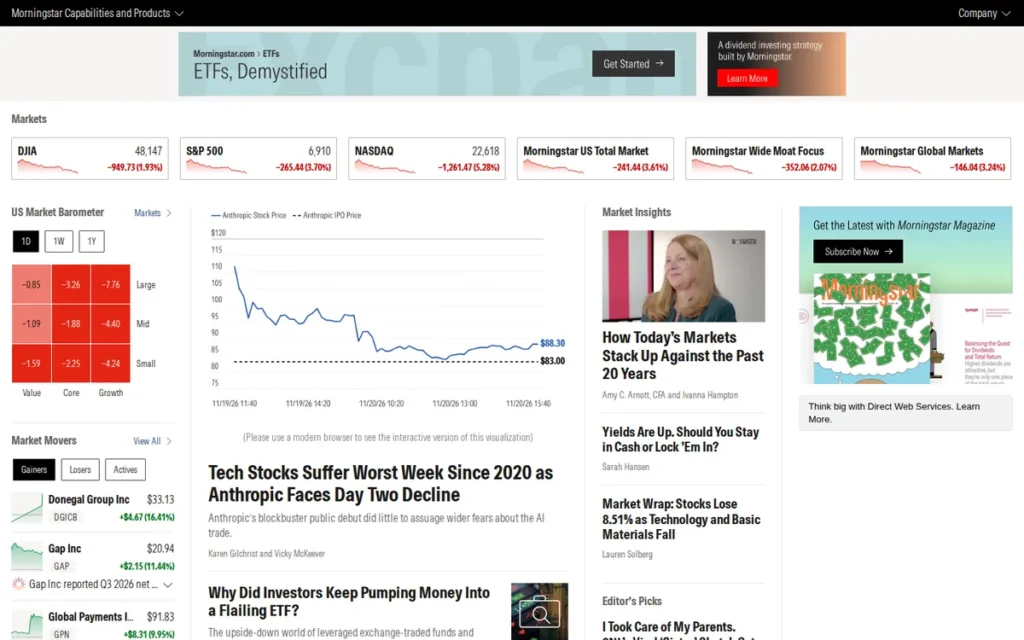
Category: Analyst Research Platform, publishes its own analyst valuations and ratings instead of crowdsourced contributor articles.
At a Glance
- Category: Analyst Research Platform
- Best For: Long-term buy-and-hold, stock, and fund/ETF investors who want analyst-written valuation research
- Price Range: $249/year billed annually or $34.95/month; 7-day trial (Morningstar pricing, November 2026)
- Primary Strength: Morningstar Investor gives each covered stock an analyst fair-value estimate, uncertainty rating and moat assessment under a published framework.
- Biggest Limitation: Morningstar Investor offers one house analyst view rather than the range of contributor opinions and article volume Seeking Alpha provides.
- One-Line Summary: Morningstar Investor is the closest Seeking Alpha alternative for investors who want analyst-led valuation research and fund/ETF coverage at a lower annual list price than Seeking Alpha Premium.
- Last Verified: November 2026
Overview
Morningstar Investor is Morningstar’s retail research subscription for self-directed investors who want analyst fair-value estimates, star ratings, uncertainty ratings, moat analysis and fund and ETF research in place of crowdsourced contributor articles.
Morningstar Investor is a different product from Morningstar Direct, Morningstar’s institutional platform on G2. None of Morningstar Direct’s G2 ratings or reviews apply to Morningstar Investor.
Key Features
- Morningstar Investor assigns analyst fair-value estimates to covered stocks and ties its star ratings to the gap between price and fair value.
- Morningstar Investor publishes uncertainty ratings that show how confident its analysts are in each fair-value estimate.
- Morningstar Investor includes economic-moat analysis that rates how durable a company’s competitive advantage is.
- Morningstar Investor covers mutual funds and ETFs alongside stocks, which suits fund-heavy portfolios.
- Morningstar Investor offers monthly billing at $34.95 and a 7-day trial for new users (Morningstar pricing, November 2026).
Best For
Morningstar Investor is best for long-term investors and fund or ETF holders who mainly use Seeking Alpha to read valuation analysis and want one consistent analyst framework.
Pricing
Morningstar Investor costs $249/year billed annually, or $34.95/month billed monthly, which is about $419/year (Morningstar pricing, November 2026). New users get a 7-day trial. A $199 first-year promotion was also reported in November 2026.
Morningstar Investor’s annual plan costs about $50 less than Seeking Alpha Premium’s $299/year list price. Morningstar Investor has no free tier.
Strengths
- Morningstar Investor documents how its stock ratings work and ties them to fair-value estimates and uncertainty ratings (Morningstar help center, November 2026).
- Morningstar Investor costs $249/year on annual billing, about $50 below Seeking Alpha Premium’s $299 list price (vendor pages, November 2026).
- Morningstar Investor and Koyfin were the only alternatives named in all three AI answers we sampled (Perplexity and ChatGPT, November 2026).
- Morningstar Investor’s fund and ETF coverage suits investors who find article-focused services a poor fit (Morningstar, November 2026).
Limitations
- Morningstar Investor gives up a range of opinions in exchange for consistency, so investors who value debate between contributors will find less of it.
- Morningstar Investor’s documented strengths are valuation and fund research, not active-trading charts or real-time screening.
- Morningstar Investor has no free tier, and its $34.95 monthly option costs about $419/year, so the $249 price requires an annual commitment.
Users on r/personalfinance pointed out how differently Morningstar’s ratings work for funds and stocks:
“Their ratings for funds are based on past performance compared to its benchmark. If you don’t believe that is necessarily indicative of future performance, then their ratings are not very relevant.
The star ratings that M* uses for individual stocks, on the other hand, are based on their estimate of fair value compared to current stock price, where 5-star stocks are trading well below what they think is fair value.” Posted by u/ziggy029
Takeaway: Morningstar Investor’s stock star ratings rest on forward-looking fair-value estimates, but its fund star ratings draw skepticism because they reflect past performance against a benchmark.
How It Compares With Seeking Alpha
Morningstar Investor replaces Seeking Alpha’s contributor analysis with house analyst research and its quant grades with fair-value star ratings. It also adds fund and ETF research. Morningstar Investor does not replace Seeking Alpha’s contributor community or its high volume of news.
Morningstar Investor’s annual list price is about $50 lower than Seeking Alpha Premium’s $299.
Verdict
Morningstar Investor is the best Seeking Alpha alternative for investors who want analyst-led valuation research and fund coverage for less than Seeking Alpha Premium’s list price. Readers who rely on many contributor opinions or on fast trading data should pair it with a screener.
Morningstar Investor ranks #1 (3.90) on the highest methodology score in this list (5/5) and an annual price below Seeking Alpha Premium’s. Morningstar Investor loses points for having no free tier.
2. Koyfin: Best for Charts, Market Data, and Dashboards
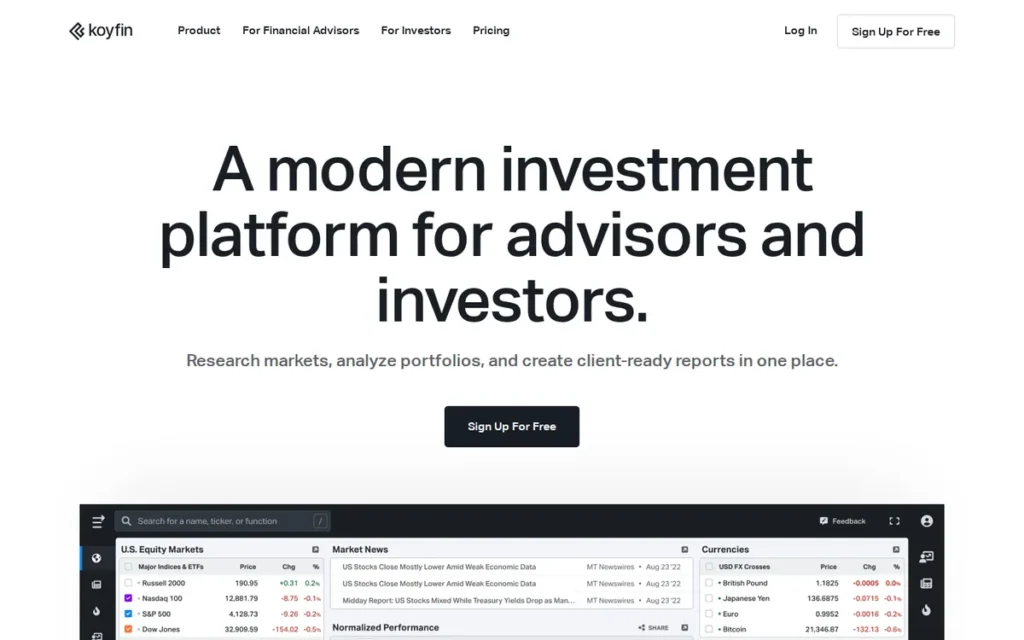
Category: Data & Charting Terminal, provides financials, estimates, charts and dashboards so investors can form their own view.
At a Glance
- Category: Data & Charting Terminal
- Best For: Data-driven investors who build their own thesis from financials, estimates, charts and macro context
- Price Range: Free plan; Plus $39/month; Premium $79/month; annual billing saves up to 30% (Koyfin pricing page, November 2026)
- Primary Strength: Koyfin combines 10 years of financials and estimates, stock and ETF screeners, transcripts and macro dashboards on its Plus plan.
- Biggest Limitation: Koyfin provides no contributor articles or proprietary buy/sell ratings, so it replaces Seeking Alpha’s data but not its written analysis.
- One-Line Summary: Koyfin is the highest-ranked data-first Seeking Alpha alternative in our scoring, with a usable free plan and paid tiers offering 10 years of financials, estimates and transcripts.
- Last Verified: November 2026
Overview
Koyfin is a financial data and charting platform for self-directed investors who want company financials, analyst estimates, screeners, transcripts and custom market dashboards to do their own research instead of reading contributor articles.
Koyfin offers a free plan plus paid Plus and Premium tiers. Koyfin suits readers who use Seeking Alpha mainly for its data pages rather than its articles.
Key Features
- Koyfin’s Plus plan lists 10 years of company financials and analyst estimates.
- Koyfin includes stock and ETF screeners, and the free plan allows 2 saved screens.
- Koyfin provides customizable dashboards that combine company, ETF and macro market data.
- Koyfin’s paid tiers include company filings and earnings call transcripts.
- Koyfin shows ETF holdings data for fund and ETF analysis.
Best For
Koyfin is best for investors who build their own view from data and charts and find contributor commentary noisy or opinion-heavy.
Pricing
Koyfin offers a free plan, Plus at $39/month and Premium at $79/month (Koyfin pricing page, November 2026). At monthly rates, Plus costs $468/year and Premium costs $948/year.
Koyfin’s annual billing saves up to 30%, which puts Plus at about $328/year (Koyfin pricing page, November 2026; confirm at checkout). Even with the discount, Koyfin Plus costs more per year than Seeking Alpha Premium’s $299 list price.
Strengths
- Koyfin’s Plus plan lists 10 years of financials and estimates, plus filings, transcripts and stock and ETF screens (Koyfin pricing page, November 2026).
- Koyfin’s free plan includes 2 watchlists, 2 screens, 2 dashboards, 2 years of financials and 1 year of estimates, so readers can test the workflow before paying (Koyfin pricing page, November 2026).
- Koyfin and Morningstar Investor were the only alternatives named in all three AI answers we sampled (Perplexity and ChatGPT, November 2026).
- Koyfin covers ETF holdings and macro data, which article-focused services cover thinly (Koyfin, November 2026).
Users on r/TraderTools noted:
“Trialling it and yes it is a great platform. Basically a cheaper version of FactSet but obviously with less features. Great for retail / smaller organisations with more limited budgets” Posted by u/Alive_Arachnid_7268
Takeaway: Koyfin users see it as a budget-friendly stand-in for professional terminals like FactSet, accepting a thinner feature set in exchange for a retail-friendly price.
Limitations
- Koyfin gives up written analysis in exchange for raw data and publishes no contributor theses or proprietary ratings, so readers who depend on Seeking Alpha’s articles will need a second tool.
- Koyfin Plus costs about $328/year even with the annual discount, above Seeking Alpha Premium’s $299 list price.
- Koyfin’s free plan caps usage at 2 watchlists, 2 screens and 2 dashboards, with only 2 years of financials and 1 year of estimates.
How It Compares With Seeking Alpha
Koyfin replaces Seeking Alpha’s financial data, estimates, screening, charts and transcripts. Koyfin does not replace contributor articles, quant ratings or stock picks.
Koyfin’s free tier includes dashboards, 2 screens and 2 years of financials, which is more access for data work than Seeking Alpha Basic documents. Koyfin’s paid Plus plan costs more per year than Seeking Alpha Premium.
Verdict
Koyfin is the best Seeking Alpha alternative for investors who research with data, charts and dashboards rather than articles. Readers who want a written thesis or a buy/sell rating will find Koyfin incomplete on its own.
Koyfin ranks #2 (3.85) on top scores for data depth and free access (5/5 each). Koyfin loses points because Plus costs more than Seeking Alpha Premium and because Koyfin publishes no proprietary ratings.
3. Stock Analysis: Best Free and Lowest-Cost Seeking Alpha Alternative
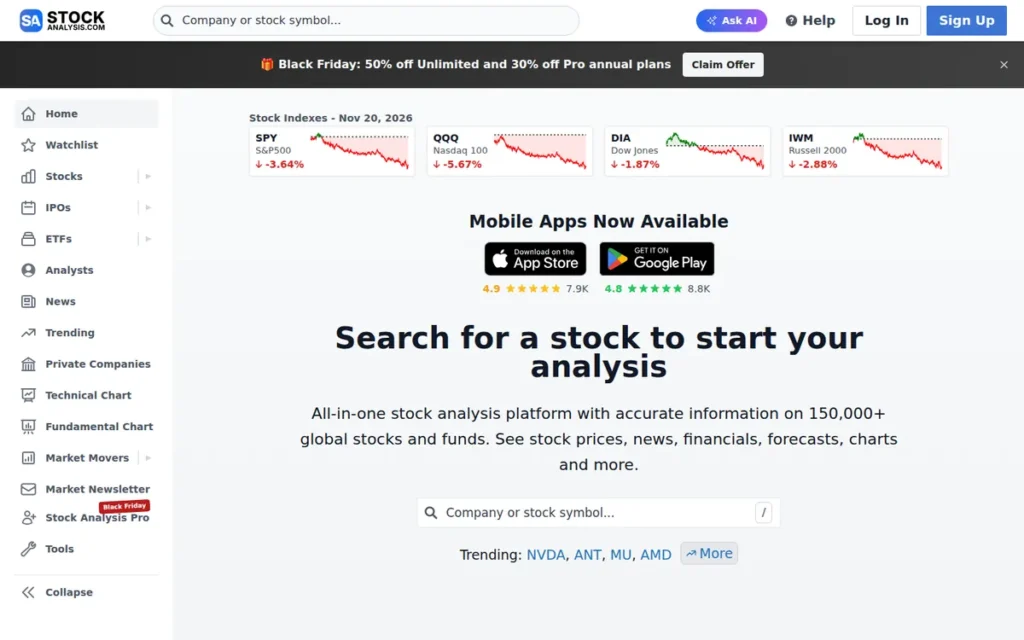
Category: Data & Charting Terminal, provides financials, estimates, charts and dashboards so investors can form their own view.
At a Glance
- Category: Data & Charting Terminal
- Best For: Cost-conscious investors who want free financial statements, ratios and screening, with an inexpensive upgrade
- Price Range: Free; Pro $79/year or $9.99/month (Stock Analysis, November 2026; promotions may change first-year price)
- Primary Strength: Stock Analysis offers free financial statements, ratios and a stock screener, with Pro priced at $79/year.
- Biggest Limitation: Stock Analysis aggregates Wall Street ratings and publishes no original analysis or proprietary ratings.
- One-Line Summary: Stock Analysis is the lowest-cost Seeking Alpha alternative, offering free financial data and screening and a $79/year Pro plan that adds extended history, saved screens and more alerts.
- Last Verified: November 2026
Overview
Stock Analysis is a stock data website for individual investors who want free financial statements, ratios, company pages and a screener, plus an optional low-cost Pro plan, instead of paying for a full research subscription.
Stock Analysis aggregates Wall Street analyst ratings instead of issuing its own picks. Stock Analysis Pro adds extended history, saved screens and more alerts.
Key Features
- Stock Analysis provides free company pages with financial statements and key ratios.
- Stock Analysis includes a free stock screener, and Stock Analysis Pro adds saved screens.
- Stock Analysis Pro extends financial history beyond the free tier’s roughly five years.
- Stock Analysis Pro adds more price and data alerts than the free plan.
- Stock Analysis aggregates Wall Street analyst ratings rather than publishing its own recommendations.
Best For
Stock Analysis is best for buy-and-hold and dividend investors who mainly use Seeking Alpha for financials and screening and want to cut their research costs sharply.
Pricing
Stock Analysis is free to use. Stock Analysis Pro costs $79/year, or $9.99/month month-to-month, which is about $120/year (Stock Analysis, November 2026). First-year promotions may differ.
At its annual price, Stock Analysis Pro costs about $220/year less than Seeking Alpha Premium’s $299 list price.
Strengths
- Stock Analysis Pro’s $79/year list price is the lowest verified paid price among the eight alternatives (Stock Analysis, November 2026).
- Stock Analysis offers free financial statements, ratios and screening, so investors can replace Seeking Alpha’s data pages at no cost (Stock Analysis, November 2026).
- Stock Analysis states in its FAQ that it aggregates Wall Street ratings rather than issuing recommendations, so readers know what its ratings represent (Stock Analysis, November 2026).
- Stock Analysis was named the free or low-cost starting point in two of the three AI answers we sampled (Perplexity and ChatGPT, November 2026).
The founder of a competing research tool, posting a self-disclosed comparison on r/InsightAnalytics, wrote:
“Stock Analysis is the best free stock research site on the internet right now. Koyfin free (two watchlists, two years of financials, the charts) is next.” Posted by u/Impensus
Takeaway: Even the founder of a competing tool calls Stock Analysis the best free research site, which supports its place as the default $0 starting point.
Limitations
- Stock Analysis gives up depth of insight in exchange for low cost and publishes no original analysis, contributor articles or proprietary quant ratings.
- Stock Analysis documents narrower data depth (ratios, statements and extended history on Pro) than the estimates, transcripts and dashboards on Koyfin or TIKR.
- Stock Analysis’s free plan is ad-supported and limits financial history to about five years, and downloads are reserved for Pro (StockResearchHub, November 2026).
How It Compares With Seeking Alpha
Stock Analysis replaces Seeking Alpha’s financial data pages, basic screening and alerts, and it shows aggregated analyst ratings. Stock Analysis does not replace contributor analysis, quant ratings or Alpha Picks.
Stock Analysis Pro costs about a quarter of Seeking Alpha Premium’s $299 list price.
Verdict
Stock Analysis is the best Seeking Alpha alternative for investors who want to cut their research costs to zero or $79 a year. Readers who pay Seeking Alpha mainly for written analysis or quant grades will need to add a research source.
Stock Analysis ranks #3 (3.80) on top scores for cost and free access (5/5 each). Stock Analysis loses points because it covers fewer Seeking Alpha jobs and publishes no ratings of its own.
4. Stock Rover: Best for Fundamental Screening and Portfolio Analysis
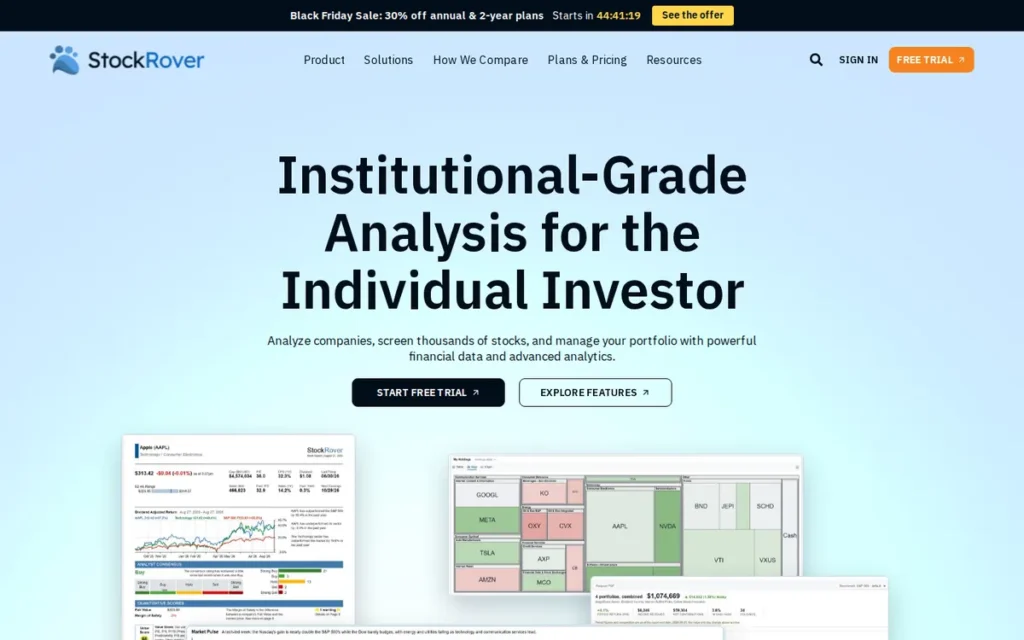
Category: Screener & Portfolio Analyzer, filters stocks by fundamentals or technicals and tracks or analyzes holdings.
At a Glance
- Category: Screener & Portfolio Analyzer
- Best For: Fundamental, dividend and growth investors who screen deeply and want to analyze their own portfolio
- Price Range: Free plan; Premium $348/year or $34/month; Premium Plus $588/year; 14-day Ultimate trial (Stock Rover, November 2026)
- Primary Strength: Stock Rover combines stock and ETF screening and portfolio analysis with up to 800+ metrics and 20 years of fundamentals on its top tiers.
- Biggest Limitation: Stock Rover Premium costs $348/year, about $49 more than Seeking Alpha Premium’s list price, and includes no written analysis.
- One-Line Summary: Stock Rover is the Seeking Alpha alternative for investors who mainly screen fundamentals and track portfolios, with a free plan and up to 800+ metrics and 20 years of history on its top tiers.
- Last Verified: November 2026
Overview
Stock Rover is a fundamental research and portfolio analysis platform for self-directed investors who want deep stock and ETF screening, side-by-side comparisons, long financial history and portfolio tracking instead of an article feed.
Stock Rover offers a free plan, and Stock Rover keeps its deepest data on its higher-priced tiers.
Key Features
- Stock Rover provides stock and ETF screeners that filter by fundamental metrics.
- Stock Rover Premium includes 400+ metrics and five years of fundamentals, and Premium Plus includes 700+ metrics and ten years.
- Stock Rover’s top tiers list up to 800+ metrics and 20 years of historical fundamentals.
- Stock Rover includes side-by-side comparisons of companies and funds.
- Stock Rover offers portfolio tracking and analysis tools, plus research reports that add depth on higher tiers.
Best For
Stock Rover is best for investors who use Seeking Alpha mainly to screen stocks and track a portfolio rather than to read articles.
Pricing
Stock Rover offers a free plan and a 14-day Ultimate trial with no credit card required. Stock Rover Premium costs $348/year billed annually or $34/month month-to-month, and Premium Plus costs $588/year (Stock Rover, November 2026).
Stock Rover Premium costs about $49/year more than Seeking Alpha Premium’s $299 list price.
Strengths
- Stock Rover lists up to 800+ metrics and 20 years of fundamentals on its top tiers, the deepest documented history in this list (Stock Rover, November 2026).
- Stock Rover combines screening, comparisons and portfolio tracking in one product, covering two Seeking Alpha jobs at once (Stock Rover, November 2026).
- Stock Rover offers a free plan and a 14-day Ultimate trial with no credit card required (Stock Rover, November 2026).
- Stock Rover was the screening and portfolio pick in both ChatGPT answers we sampled (ChatGPT, November 2026).
Limitations
- Stock Rover gives up narrative in exchange for numbers and publishes no contributor analysis, so readers who want someone else’s thesis will find it tool-heavy.
- Stock Rover Premium includes only 400+ metrics and five years of fundamentals, and ten years requires Premium Plus at $588/year.
- Stock Rover Premium costs $348/year on annual billing, more than Seeking Alpha Premium’s list price.
How It Compares With Seeking Alpha
Stock Rover replaces Seeking Alpha’s screening, portfolio tracking and financial history, with up to 800+ metrics on its top tiers. Stock Rover does not replace contributor articles or stock picks.
Stock Rover Premium costs about $49/year more than Seeking Alpha Premium’s $299 list price.
Verdict
Stock Rover is the best Seeking Alpha alternative for investors whose research centers on screening fundamentals and analyzing their own portfolio. Readers who want written analysis, or who want to spend less than Seeking Alpha Premium, should look at Morningstar Investor or Stock Analysis.
Stock Rover ranks #4 (3.70) on top data depth (5/5) and a free plan. Stock Rover ties TIKR and wins the tie-break on AI-answer coverage, with two of three answers against TIKR’s one.
5. TIKR: Best for Global Fundamentals, Estimates, and Earnings Transcripts
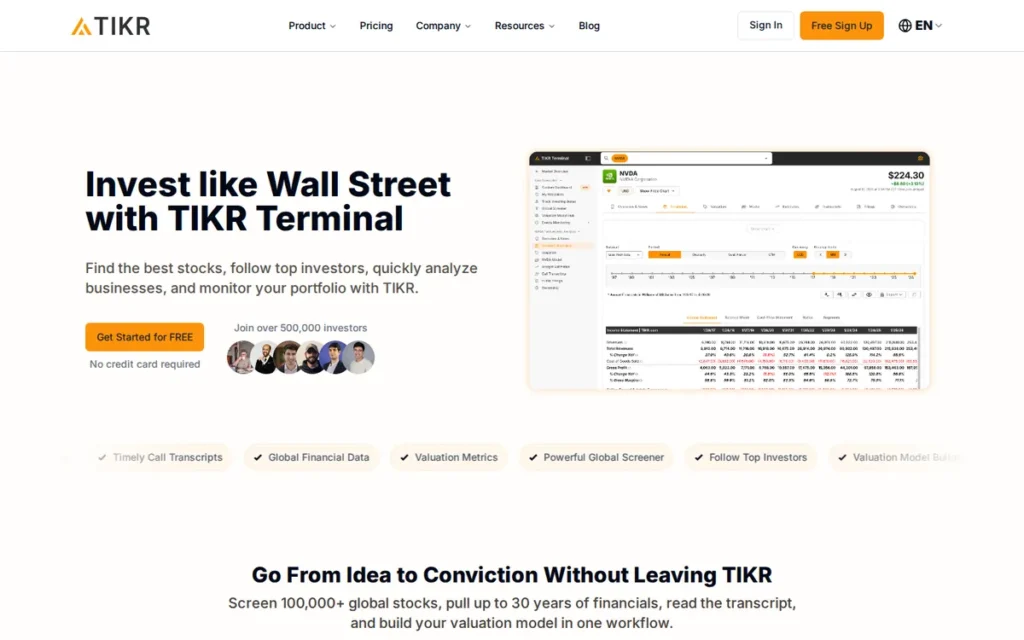
Category: Data & Charting Terminal, provides financials, estimates, charts and dashboards so investors can form their own view.
At a Glance
- Category: Data & Charting Terminal
- Best For: Fundamental investors researching international companies through financial history, estimates and earnings calls
- Price Range: Free (U.S. stocks); Plus $215.40/year billed annually or $24.95/month; Pro $455.40/year billed annually (TIKR pricing page, November 2026)
- Primary Strength: TIKR provides global company financials, analyst estimates and earnings call transcripts on its paid tiers.
- Biggest Limitation: TIKR’s free plan covers only U.S. stocks, and TIKR’s lowest paid price of $215.40/year requires annual billing.
- One-Line Summary: TIKR is the Seeking Alpha alternative for fundamental investors who need global financial history, analyst estimates and earnings transcripts, with a free plan limited to U.S. stocks.
- Last Verified: November 2026
Overview
TIKR is a research data platform for self-directed fundamental investors who want company financial history, analyst estimates and earnings call transcripts, with global stock coverage on paid tiers, instead of contributor articles.
TIKR’s free plan covers U.S. stocks only, so TIKR users focused on international companies will need a paid tier.
Key Features
- TIKR provides company financial statements, with longer history on paid tiers.
- TIKR includes analyst estimates, with more estimate data on higher tiers.
- TIKR offers earnings call transcripts, with longer transcript history on paid plans.
- TIKR’s paid tiers extend coverage to stocks outside the U.S.
- TIKR’s free plan gives access to U.S. stock data at no cost.
Best For
TIKR is best for long-term fundamental investors who analyze international companies and read earnings calls themselves.
Pricing
TIKR offers a free plan for U.S. stocks. TIKR Plus costs $24.95/month billed monthly ($299.40/year) or $17.95/month billed annually ($215.40/year). TIKR Pro costs $54.95/month, or $455.40/year billed annually (TIKR pricing page, November 2026).
On annual billing, TIKR Plus costs about $84 less than Seeking Alpha Premium’s $299 list price.
Strengths
- TIKR’s paid tiers add global stock coverage, longer financial history, more estimates and longer transcript history (TIKR pricing page, November 2026).
- TIKR Plus costs $215.40/year on annual billing, about $84 less than Seeking Alpha Premium’s $299 list price (TIKR pricing page, November 2026).
- TIKR offers a free plan covering U.S. stocks, which is enough to test the workflow before paying (TIKR pricing page, November 2026).
- TIKR puts financials, estimates and transcripts in one interface, so investors don’t need separate sources for earnings-call research (TIKR, November 2026).
Limitations
- TIKR gives up opinion in exchange for raw fundamentals and offers no contributor analysis, proprietary ratings or documented portfolio tools.
- TIKR’s $215.40/year price requires annual billing, and month-to-month TIKR Plus costs $299.40/year, about the same as Seeking Alpha Premium.
- TIKR Pro costs $455.40/year even on annual billing, so the deepest TIKR data costs well above Seeking Alpha Premium.
How It Compares With Seeking Alpha
TIKR replaces Seeking Alpha’s financial data, estimates and transcripts, and it adds global coverage. TIKR does not replace articles, quant ratings, stock picks or portfolio tracking.
TIKR Plus costs less than Seeking Alpha Premium on annual billing and about the same on monthly billing.
Verdict
TIKR is the best Seeking Alpha alternative for investors who need global fundamentals and earnings transcripts in one place. Readers who want written analysis, ratings or portfolio tracking should use TIKR alongside another tool rather than as a full replacement.
TIKR ranks #5 (3.70) on top data depth (5/5) and a below-Seeking-Alpha annual price. TIKR ties Stock Rover and loses the tie-break on AI-answer coverage, with one of three answers against Stock Rover’s two.
6. TipRanks: Best for Aggregated Analyst Ratings With Track Records
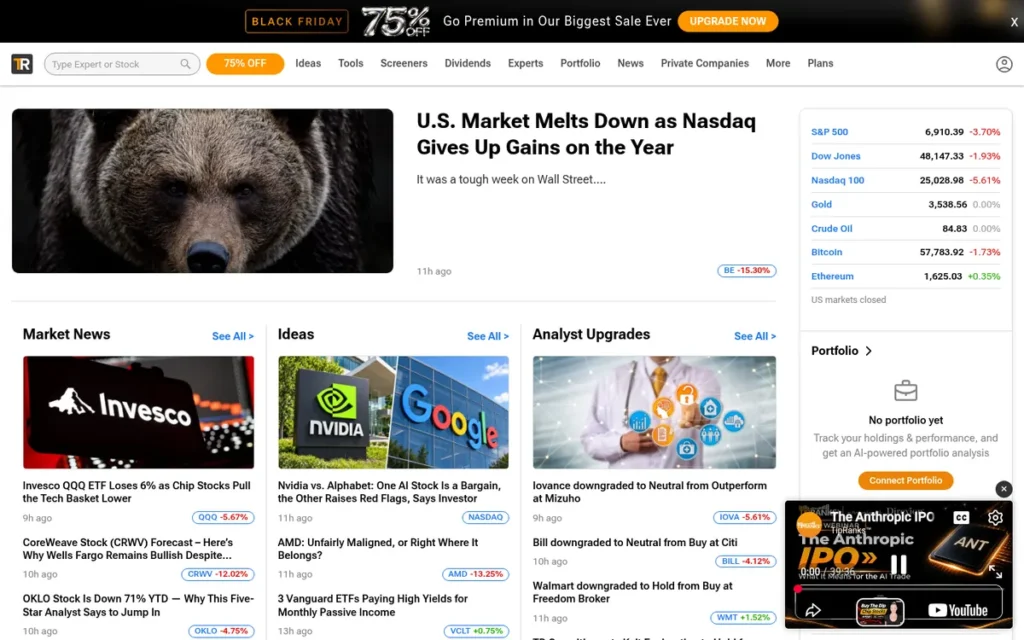
Category: Ratings Signal Service, turns analyst ratings or earnings-estimate revisions into a ranked buy/sell signal.
At a Glance
- Category: Ratings Signal Service
- Best For: Investors who rely on ratings and want to know which Wall Street analysts have a track record
- Price Range: Free Basic plan; Premium $360/year; Ultimate $600/year; 30-day money-back guarantee on yearly plans (TipRanks plans page, November 2026)
- Primary Strength: TipRanks aggregates Wall Street analyst ratings and tracks each analyst’s past performance.
- Biggest Limitation: TipRanks Premium costs $360/year, about $61 more than Seeking Alpha Premium’s list price, and complete expert rankings require the $600/year Ultimate plan.
- One-Line Summary: TipRanks is the Seeking Alpha alternative for ratings-focused investors who want analyst recommendations shown alongside each analyst’s tracked historical performance.
- Last Verified: November 2026
Overview
TipRanks is an analyst-ratings aggregation platform for self-directed investors who want to see Wall Street ratings next to each analyst’s tracked past performance, instead of relying on Seeking Alpha’s factor-based quant grades or contributor opinions.
TipRanks offers a free Basic plan and paid Premium and Ultimate plans.
Key Features
- TipRanks aggregates Wall Street analyst ratings on individual stocks.
- TipRanks tracks analysts’ past performance, so readers can weigh each rating by its source’s record.
- TipRanks Premium includes research tools, expert insights, Smart Portfolio, following up to 30 stocks and PDF export (TipRanks plans page, November 2026).
- TipRanks Ultimate adds risk analysis, complete expert rankings, unlimited email alerts and CSV export (TipRanks plans page, November 2026).
- TipRanks offers a free Basic plan for readers who want to see the ratings view before subscribing.
Best For
TipRanks is best for investors who mainly use Seeking Alpha’s ratings and want a signal based on analyst track records rather than factor grades.
Pricing
TipRanks offers a free Basic plan. TipRanks Premium costs $360/year ($30/month equivalent) and TipRanks Ultimate costs $600/year, with a 30-day money-back guarantee on yearly plans (TipRanks plans page, November 2026).
TipRanks Premium costs about $61 more per year than Seeking Alpha Premium’s $299 list price.
Strengths
- TipRanks tracks analysts’ past performance alongside their ratings, which speaks directly to the question of which ratings to trust (TipRanks, November 2026).
- TipRanks offers a different trust model from Seeking Alpha’s quant grades, weighting human analysts by their record instead of scoring factors (TipRanks, November 2026).
- TipRanks offers yearly plans with a 30-day money-back guarantee (TipRanks plans page, November 2026).
- TipRanks provides a free Basic plan, so readers can try the ratings view at no cost (TipRanks plans page, November 2026).
Limitations
- TipRanks gives up breadth in exchange for focus: it centers on analyst ratings rather than full financials, deep screening or written analysis, so it works best as a second tool.
- TipRanks Premium costs $360/year, and complete expert rankings require TipRanks Ultimate at $600/year.
- TipRanks’ analyst track records describe past results, not future accuracy.
How It Compares With Seeking Alpha
TipRanks replaces or complements Seeking Alpha’s ratings, using aggregated analyst ratings instead of factor-based quant grades. TipRanks Premium adds portfolio tracking through Smart Portfolio. TipRanks does not replace contributor articles or deep financial data.
TipRanks Premium costs about $61 more per year than Seeking Alpha Premium’s list price.
Verdict
TipRanks is the best Seeking Alpha alternative for investors who want ratings backed by each analyst’s tracked performance. TipRanks answers the question of which ratings to trust more directly than most tools here.
TipRanks ranks #6 (3.20) on a strong methodology score (4/5). TipRanks loses points because it covers fewer Seeking Alpha jobs than the top five and costs more than Seeking Alpha Premium.
7. Finviz: Best for Fast Screening and Active Traders
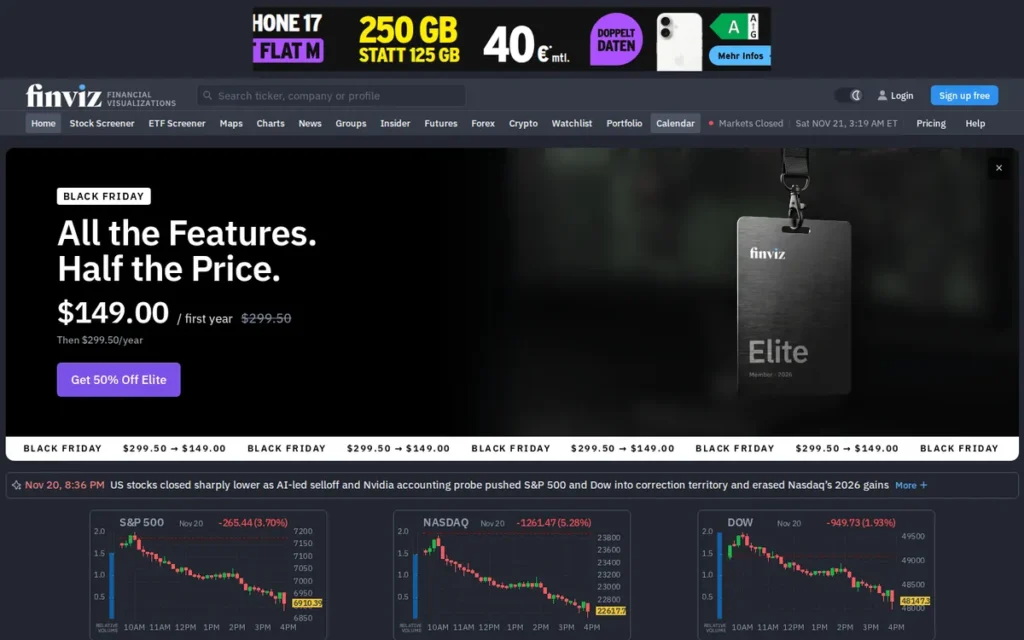
Category: Screener & Portfolio Analyzer, filters stocks by fundamentals or technicals and tracks or analyzes holdings.
At a Glance
- Category: Screener & Portfolio Analyzer
- Best For: Active traders and investors who scan the market quickly using screens, charts and alerts
- Price Range: Free (delayed data); Elite $149 first year on annual offer, then $299.50/year, or $39.50/month (Finviz Elite page, November 2026)
- Primary Strength: Finviz offers a fast stock screener, and Finviz Elite adds real-time quotes, charts, alerts and exports.
- Biggest Limitation: Finviz offers no in-depth company write-ups, and its free screener uses delayed data.
- One-Line Summary: Finviz is the Seeking Alpha alternative for traders and screen-first investors, offering a free delayed-data screener and an Elite plan with real-time quotes, alerts and exports.
- Last Verified: November 2026
Overview
Finviz is a stock screening and market-monitoring website for active traders and screen-first investors who want to filter stocks quickly, scan charts and set alerts. Finviz offers a free delayed-data screener and a paid real-time Elite plan.
Finviz is a monitoring tool, not a source of written company analysis.
Key Features
- Finviz provides a stock screener that filters by fundamental and technical criteria.
- Finviz Elite adds an advanced screener with real-time quotes.
- Finviz Elite includes charting tools for chart-based market scans.
- Finviz Elite offers alerts and data exports for monitoring watchlists.
- Finviz’s free screener needs no subscription but uses delayed data.
Best For
Finviz is best for active traders and investors who use Seeking Alpha’s screener more than its articles and want fast market scans.
Pricing
Finviz Elite costs $149 for the first year on the annual offer, then renews at $299.50/year, about $24.96/month. Monthly billing costs $39.50/month (Finviz Elite page, November 2026).
AI answers quoted different Finviz prices because some captured the promotional price and others the renewal price. Finviz Elite’s renewal price is about equal to Seeking Alpha Premium’s $299 list price.
Strengths
- Finviz Elite lists an advanced screener, real-time quotes, charts, alerts and exports on its official page (Finviz Elite page, November 2026).
- Finviz offers a free screener, so screen-first investors can replace Seeking Alpha’s screening at no cost if delayed data is acceptable (Finviz, November 2026).
- Finviz Elite’s $149 first-year offer is about half of Seeking Alpha Premium’s $299 list price (vendor pages, November 2026).
- Finviz Elite offers monthly billing at $39.50, unlike Seeking Alpha Premium’s annual-only plan (Finviz Elite page, November 2026).
Limitations
- Finviz gives up depth in exchange for speed: it is a screening and monitoring tool, so long-term investors who want company analysis will find it thin.
- Finviz’s free screener uses delayed data, which matters for traders who act intraday.
- Finviz Elite renews at $299.50/year after the $149 first year, which erases most of the saving against Seeking Alpha Premium.
This aligns with community sentiment on r/algotrading:
“If you rely on the free version, the 15-minute delay absolutely renders a ‘+5 min’ strategy moot. You won’t see the move until market open +20.
Even with Elite, a screener gives you a snapshot, not a precise time-log. Since you need specific timestamps, you are better off using a simple API (like Polygon or Alpaca) and writing a Python script to log prices at those exact intervals. It’s cleaner, cheaper, and actually actionable compared to refreshing a web page.” Posted by u/crowlyvideo
Takeaway: Finviz’s free screener is too delayed for time-sensitive intraday strategies, and even Finviz Elite gives snapshots rather than the precise timestamped data that algorithmic traders need.
How It Compares With Seeking Alpha
Finviz replaces Seeking Alpha’s screening, and Finviz Elite adds real-time charts and alerts. Finviz does not replace articles, quant ratings, fund research or stock picks.
Finviz Elite’s first year costs less than Seeking Alpha Premium, and its renewal costs about the same.
Verdict
Finviz is the best Seeking Alpha alternative for active traders who need fast screens, charts and real-time alerts. Readers should budget for the renewal price, not the first-year offer, and add a research source if they want analysis.
Finviz ranks #7 (2.95) mainly because its methodology transparency score is 2/5. Finviz is a monitoring tool with no documented ratings or analysis framework.
8. Zacks: Best for Earnings-Estimate-Revision Stock Rankings
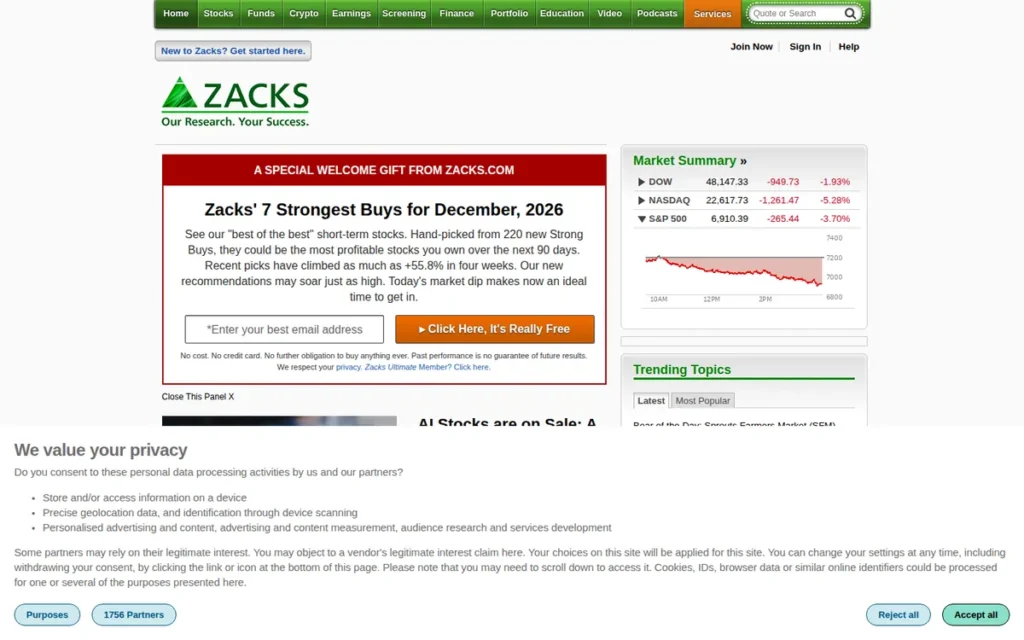
Category: Ratings Signal Service, turns analyst ratings or earnings-estimate revisions into a ranked buy/sell signal.
At a Glance
- Category: Ratings Signal Service
- Best For: Shorter- to medium-horizon investors who act on changes in analysts’ earnings estimates
- Price Range: Premium $249/year with 30-day trial (third-party pricing summaries, November 2026; confirm on zacks.com)
- Primary Strength: Zacks ranks stocks from #1 to #5 using four documented earnings-estimate-revision factors.
- Biggest Limitation: Zacks’ rankings focus on one signal type, and Zacks’ price is confirmed only by third-party summaries, not the vendor page.
- One-Line Summary: Zacks is the Seeking Alpha alternative for investors who prefer a quant ranking built on earnings-estimate revisions rather than broad factor grades or contributor opinions.
- Last Verified: November 2026
Overview
Zacks is an investment research service for self-directed investors who want stock rankings driven mainly by changes in analysts’ earnings estimates, instead of Seeking Alpha’s multi-factor quant grades and contributor articles.
Zacks suits readers who want a single, defined ranking signal. Zacks publishes that signal as the Zacks Rank.
Key Features
- Zacks Rank rates stocks from #1 (Strong Buy) to #5 (Strong Sell).
- Zacks Rank combines four estimate-revision factors: Agreement, Magnitude, Upside and Surprise (Investopedia, November 2026).
- Zacks gives investors a defined quantitative signal to compare with Seeking Alpha’s five factor grades.
- Zacks bases its ranking on one documented type of input, which makes the signal easier to interpret than a broad composite score.
- Zacks Premium is listed at $249/year with a 30-day trial in third-party pricing summaries (GeminiQ, November 2026).
Best For
Zacks is best for investors who use Seeking Alpha’s quant ratings and want a second signal, based on earnings revisions, to cross-check them.
Pricing
Third-party pricing summaries list Zacks Premium at $249/year with a 30-day trial (GeminiQ, November 2026). Weigh Apps could not confirm that figure on zacks.com, so check the official site before subscribing.
If the $249 price is confirmed, Zacks Premium would cost about $50 less per year than Seeking Alpha Premium’s $299 list price.
Strengths
- Zacks Rank combines four documented estimate-revision factors (Agreement, Magnitude, Upside and Surprise) into a #1–#5 rank (Investopedia, November 2026).
- Zacks offers a single, explainable type of ranking input, so readers can see what drives the signal (Investopedia, November 2026).
- Zacks gives Seeking Alpha users a second quant view to compare with Seeking Alpha’s factor grades (Zacks, November 2026).
- Zacks Premium offers a 30-day trial, according to third-party pricing summaries (GeminiQ, November 2026).
Limitations
- Zacks centers its rankings on earnings-estimate revisions, so investors with long horizons or a valuation-first approach may find the signal less relevant.
- Zacks’ broader research features could not be verified in our research, and Zacks’ price comes only from third-party summaries.
- Zacks’ self-reported ranking performance should be treated as vendor-reported, not independently confirmed.
How It Compares With Seeking Alpha
Zacks replaces or cross-checks Seeking Alpha’s quant ratings with a ranking based on estimate revisions. Our research did not confirm whether Zacks covers Seeking Alpha’s other jobs.
Zacks Premium may cost about $50 less than Seeking Alpha Premium once its price is confirmed on zacks.com.
Verdict
Zacks is the best Seeking Alpha alternative for investors who want a quant ranking driven by earnings-estimate revisions. Zacks works best as a second signal next to a research or data tool.
Zacks ranks #8 (2.70) because it covers the fewest documented Seeking Alpha jobs and its price is unconfirmed on the vendor page. The ranking does not reflect a weak method: Zacks scores 4/5 on methodology transparency.
Can a Two-Tool Stack Replace Seeking Alpha for Less?
A two-tool stack can replace Seeking Alpha for less if you mainly use its data and screener. Stock Analysis Pro plus the Finviz free screener costs $79/year, against Seeking Alpha Premium’s $299 list price. Stacks that add analyst research, such as Morningstar Investor plus Stock Analysis Pro ($328/year), cost more.
Here is what example stacks cost at verified list prices (vendor pages, November 2026):
- $0 free stack: Stock Analysis free, the Finviz free screener, Koyfin’s free plan and SEC EDGAR together cover financials, screening, dashboards and original filings.
- $79/year data stack: Stock Analysis Pro plus the Finviz free screener covers extended history, saved screens, alerts and fast scans.
- $215.40/year global data stack: TIKR Plus on annual billing plus the Finviz free screener covers global fundamentals, transcripts and basic screening.
- $249/year research stack: Morningstar Investor plus the Finviz free screener covers analyst valuations, fund research and basic screening.
- $328/year full stack: Morningstar Investor plus Stock Analysis Pro covers analyst research and extended data, but costs more than Seeking Alpha Premium.
Free stacks have limits you should know before relying on them:
- Finviz’s free screener uses delayed data.
- TIKR’s free plan covers U.S. stocks only.
- Koyfin’s free plan allows 2 watchlists, 2 screens, 2 dashboards and 2 years of financials.
- Stock Analysis’s free plan is ad-supported and shows about five years of history.
- Stock Rover’s free plan covers basic research, and its deep metrics require paid tiers.
Yahoo Finance and SEC EDGAR are free sources worth adding to any stack. Weigh Apps did not rank them because our research didn’t verify enough detail to score them as rigorously as the ranked tools.
When Does It Make Sense to Stay With Seeking Alpha?
Staying with Seeking Alpha makes sense if you read contributor articles and check quant ratings every day. Seeking Alpha bundles contributor analysis, ratings, screening and portfolio tools in one $299/year subscription. Replacing all of those jobs separately usually costs more than staying.
One r/SeekingAlpha user described Seeking Alpha as their daily “go to.” (r/SeekingAlpha, November 2024–October 2026)
Takeaway: Investors who use Seeking Alpha daily for several jobs get the most value from the bundle and lose the most by splitting it up.
Replacing Seeking Alpha’s three core jobs (analysis, ratings and screening) with Morningstar Investor, TipRanks Premium and the Finviz free screener costs about $609/year (vendor pages, November 2026). That is roughly double Seeking Alpha Premium’s $299 list price.
Seeking Alpha is likely still the right fit if most of these apply to you:
- You read several Seeking Alpha contributor articles a week and value opposing theses on the same stock.
- You use Seeking Alpha’s quant ratings as your primary screening signal.
- You use Seeking Alpha’s portfolio tools and news flow together in one place.
- You would need three or more separate tools to replace what you use on Seeking Alpha.
What Red Flags Should I Watch For When Evaluating Seeking Alpha Alternatives?
The biggest red flags are pricing and ratings claims that make a tool look cheaper or more trustworthy than it is. Watch for first-year promotions shown as ongoing prices, undocumented ratings, vendor-reported pick returns, limited free tiers, and pick newsletters sold as research platforms.
Red Flag #1: First-Year Promo Pricing Shown as the Ongoing Price A first-year promotion can hide a subscription’s true cost, so always budget for the renewal year. Over two years, Finviz Elite costs $448.50 ($149 plus $299.50). Seeking Alpha Premium costs $514 ($215 promotion plus $299 renewal) (vendor pages, November 2026). The renewal year, not the first year, decides which tool is cheaper.
Red Flag #2: Ratings With No Published Methodology You can’t check a rating that has no published methodology, so you can’t tell whether it is a signal or noise. Prefer services that document their inputs. Examples are Morningstar’s fair-value estimates, TipRanks’ analyst track records, Zacks’ four estimate-revision factors and Seeking Alpha’s five factor grades.
Red Flag #3: Vendor-Reported Pick Performance With No Independent Verification Treat a stock-pick track record published by the company that sells the picks as marketing until an independent source verifies it. Vendors choose which start dates, benchmarks and picks they highlight. Weigh Apps treated all user-reported and vendor-reported pick returns, including those from Alpha Picks and Zacks Rank, as sentiment rather than evidence.
Red Flag #4: Free Tiers With Delayed or Truncated Data You Didn’t Notice Free tiers often limit data in ways that are easy to miss until a trade or a research session depends on it. Common limits include Finviz’s delayed quotes and TIKR’s U.S.-only free coverage. Koyfin’s free plan shows two years of financials, and Stock Analysis’s ad-supported free plan shows about five (vendor pages, November 2026).
Red Flag #5: Paying for a Stock-Pick Newsletter When You Need a Research Platform A pick newsletter gives you recommendations, while a research platform gives you the tools to evaluate stocks yourself. Motley Fool Stock Advisor and Seeking Alpha’s Alpha Picks sell answers. Morningstar Investor, Koyfin and Stock Rover sell tools. Decide which you want before subscribing, because a newsletter rarely offers the depth of a full research platform.
What Questions Should I Ask Before Choosing a Seeking Alpha Alternative?
Six questions narrow most readers down to one or two Seeking Alpha alternatives. They cover which features you use, whether you are replacing or supplementing Seeking Alpha, the cost after promotions end, how ratings are produced, whether the free tier fits, and whether you can test first. Each answer below starts with the short version.
Question #1: Which Seeking Alpha features do I actually use every week? Most switchers use only one or two of Seeking Alpha’s six jobs (articles, quant ratings, screener, news, portfolio and picks), so a good alternative only needs to cover those. Check your last month of use. If you mostly opened the screener, Finviz or Stock Rover may replace Seeking Alpha outright.
Question #2: Am I replacing, downgrading, or supplementing Seeking Alpha? Replacing, downgrading and supplementing call for different tools, so decide which one you are doing first. Replacing calls for broad coverage, such as Morningstar Investor or Koyfin. Downgrading favors low cost, such as Stock Analysis at $79/year. Supplementing favors a specialist, such as TipRanks or Zacks, kept alongside Seeking Alpha.
Question #3: What is the normalized annual cost after any promotion ends? Convert every price to a yearly renewal figure before you compare it with Seeking Alpha Premium’s $299 list price. Koyfin Plus at $39/month is $468/year. TIKR Plus costs $215.40/year only on annual billing. Finviz Elite renews at $299.50 after a $149 first year (vendor pages, November 2026).
Question #4: How is this tool’s rating or analysis produced? Look for a methodology page that names the inputs, because each rating system measures something different. Morningstar uses fair-value estimates and TipRanks uses analyst track records. Zacks uses four estimate-revision factors, and Seeking Alpha combines five factor grades. A rating you can’t trace to its inputs is hard to weigh against the others.
Question #5: Does the free tier cover my holding period and data needs? A free tier suits long-term investors more often than active traders, because delayed data rarely matters over a holding period of several years. Active traders usually need real-time quotes, such as those on Finviz Elite. Investors in international stocks should check whether a free tier is U.S.-only, as TIKR’s is.
Question #6: Can I test this tool before paying for a full year? Most of the eight alternatives let you test before committing to an annual plan. Six offer free plans. Morningstar Investor offers a 7-day trial, Stock Rover a 14-day Ultimate trial, and TipRanks a 30-day money-back guarantee on yearly plans (vendor pages, November 2026). Use the trial period to research your real watchlist.
How Did We Rank These Seeking Alpha Alternatives?
We scored eight retail research tools from 1 to 5 on five weighted criteria. Job coverage and normalized annual cost count for 25% each, methodology transparency for 20%, and data depth and free-tier access for 15% each. The top three scores fall within 0.1 points and the top five within 0.2 points, so the “best for” labels matter more than the order.
Weigh Apps has no affiliate relationships with any company listed, and rankings are determined entirely by research data and objective evaluation criteria.
The five criteria and why they matter:
- C1 Seeking Alpha Job Coverage (25%): More coverage means fewer subscriptions. We counted seven jobs: written research, ratings, screening, charting, portfolio tracking, ETF/fund coverage, and estimates/transcripts/filings.
- C2 Normalized Annual Cost and Pricing Transparency (25%): This criterion gives a fair comparison with Seeking Alpha Premium’s $299/year list price after accounting for billing terms and promotions.
- C3 Research and Ratings Methodology Transparency (20%): Readers need to judge whether a signal can be trusted. We did not score claimed investment performance.
- C4 Data Depth and Coverage (15%): Long-term, global and fund investors need long financial history and broad coverage.
- C5 Free Tier and Low-Commitment Access (15%): Two of the questions this article answers ask about free or cheaper options.
| Rank | Tool | C1 | C2 | C3 | C4 | C5 | Weighted Score |
|---|---|---|---|---|---|---|---|
| 1 | Morningstar Investor | 4 | 4 | 5 | 4 | 2 | 3.90 |
| 2 | Koyfin | 4 | 3 | 3 | 5 | 5 | 3.85 |
| 3 | Stock Analysis | 3 | 5 | 3 | 3 | 5 | 3.80 |
| 4 | Stock Rover | 4 | 3 | 3 | 5 | 4 | 3.70 |
| 5 | TIKR | 3 | 4 | 3 | 5 | 4 | 3.70 |
| 6 | TipRanks | 3 | 3 | 4 | 3 | 3 | 3.20 |
| 7 | Finviz | 3 | 3 | 2 | 3 | 4 | 2.95 |
| 8 | Zacks | 2 | 2 | 4 | 3 | 3 | 2.70 |
Stock Rover and TIKR tied at 3.70. We broke the tie on AI-answer coverage: Stock Rover appeared in two of the three AI answers we sampled, and TIKR in one. If AI coverage also ties, the next tie-break is the higher C1 job-coverage score.
We re-scored Stock Rover, TIKR, TipRanks and Zacks in November 2026 after confirming free plans and annual prices, and those updates changed positions 4–8. Zacks keeps a C2 score of 2 until zacks.com confirms its $249/year price. A confirmed price would raise Zacks to 3.20 and #7, behind TipRanks on C1.
Our research has these limits:
- G2 has no usable reviews for the retail versions of these alternatives.
- G2 data for Morningstar Direct (4.1/5 from 439 reviews) and Morningstar Direct Advisory Suite (4.1/5 from 302 reviews) covers institutional and advisor products, so we did not apply it to Morningstar Investor (G2, November 2026).
- We excluded eMoney because it is financial-planning software for advisors, and its pricing is available only by contacting the vendor.
- We did not rank Yahoo Finance, Simply Wall St, Motley Fool Stock Advisor or SEC EDGAR, because our research did not verify enough detail to score them.
- Prices change often, so confirm every figure on the vendor’s site before subscribing.
What Do Readers Ask Most About Seeking Alpha Alternatives?
Readers most often ask which free tool replaces the most of Seeking Alpha, which paid tool is worth the money, and how Weigh Apps decides its rankings. Stock Analysis and Koyfin’s free plan lead on free access. Stock Analysis Pro, TIKR Plus and Morningstar Investor lead on paid value.
What is the best free alternative to Seeking Alpha?
Stock Analysis is the best free Seeking Alpha alternative for financial statements, ratios and screening, and Koyfin’s free plan is the best free option for dashboards. Neither tool publishes written analysis or proprietary ratings. Adding the Finviz free screener and SEC EDGAR filings builds a $0 stack, with delayed quotes and usage caps as the main trade-offs.
What is the cheapest Seeking Alpha alternative worth paying for?
Stock Analysis Pro is the cheapest verified paid Seeking Alpha alternative at $79/year (or $9.99/month). That is about $220 below Seeking Alpha Premium’s $299 list price (vendor pages, November 2026). TIKR Plus, at $215.40/year billed annually, is the cheapest option for global fundamentals. Morningstar Investor, at $249/year, is the cheapest option with analyst research.
How does Weigh Apps determine rankings?
Weigh Apps scores each tool from 1 to 5 on five published, weighted criteria. Job coverage and annual cost count for 25% each, methodology transparency for 20%, and data depth and free access for 15% each. Scores come from dated vendor pages, G2 data, Reddit sentiment and AI-answer sampling, and we disclose ties, re-scores and evidence gaps.
What Do Key Seeking Alpha Alternative Terms Mean?
These terms come up often when you compare stock research platforms and their pricing pages. Knowing them helps you judge what a subscription actually delivers, how far to trust its ratings, and whether a listed price is the one you will keep paying after the first year.
Fair-value estimate: An analyst’s estimate of what a stock is worth, based on a valuation model. Comparing the fair-value estimate with the market price shows whether the analyst thinks the stock is cheap or expensive.
Economic moat: A rating of how durable a company’s competitive advantage is. A wider moat suggests profits are better protected from competitors over time.
Uncertainty rating: A measure of how confident an analyst is in a fair-value estimate. A higher uncertainty rating means the true value could fall within a wider range.
Quant rating: A rating generated by a model that scores measurable factors such as valuation, growth or momentum. Buyers should check which factors a quant rating uses and how they are weighted.
Earnings-estimate revision: A change in analysts’ forecasts of a company’s future earnings. Some ranking systems treat rising or falling estimates as a signal for where the stock may move.
Aggregated analyst ratings: A combined view of many Wall Street analysts’ buy, hold and sell ratings on a stock. Aggregated ratings show the consensus view but are not original analysis.
Analyst track record: A history of how accurate an individual analyst’s past ratings were. An analyst track record helps readers decide how much weight to give a rating, though past accuracy does not guarantee future results.
Delayed data: Market quotes shown with a time lag rather than in real time. Delayed data is usually fine for long-term investors but can mislead active traders.
Normalized annual cost: A subscription’s price converted to one yearly figure at its renewal rate. Normalized annual cost is the fairest way to compare plans billed monthly, annually or with promotions.
Introductory (promotional) price: A discounted price for the first billing period only. Buyers should budget for the renewal price that follows the introductory price.
Earnings call transcript: A written record of a company’s quarterly call with analysts. Transcripts let investors read management’s own explanations instead of someone else’s summary.
Stock screener: A tool that filters the market by criteria such as valuation ratios, dividend yield or price trends. The number of metrics available and how fresh the data is decide how useful a screener is.
Which Seeking Alpha Alternative Is Right for You?
Key Insights
The right Seeking Alpha alternative depends on the job you pay Seeking Alpha for. Morningstar Investor fits analyst-led research at $249/year, Koyfin fits data and dashboards, and Stock Analysis fits cost-cutters at $0 or $79/year. Readers who use contributor articles and quant ratings every day may get the best value by staying.
- Morningstar Investor is the top-ranked Seeking Alpha alternative for analyst-led research, at $249/year against Seeking Alpha Premium’s $299 list price (vendor pages, November 2026).
- The top five alternatives score within 0.2 points of each other, so the “best for” label matters more than the order.
- Stock Analysis Pro, at $79/year, is the cheapest verified paid option, and TIKR Plus, at $215.40/year billed annually, is the cheapest option for global data.
- None of the eight ranked tools replaces Seeking Alpha’s full bundle on its own, and a three-tool replacement can cost about $609/year.
Use your investing style to pick a starting point:
- Buy-and-hold and fund investors should start with Morningstar Investor.
- Data-first investors should try Koyfin’s free plan, or TIKR for international stocks.
- Cost-cutters should start with Stock Analysis.
- Investors who mainly screen and track a portfolio should look at Stock Rover.
- Active traders should try Finviz.
- Readers who rely on ratings should add TipRanks or Zacks as a second signal.
Prices and plans change, so check every figure on the vendor’s site before you subscribe. For full scoring details, read the Weigh Apps section “How Did We Rank These Seeking Alpha Alternatives?” and see our other independent investing-tool reviews on Weigh Apps.
We update this guide quarterly. Last updated: November 21, 2026.